Corporate Funding was developed on Jul.24, 2024.
CFO Handbook: Part 1, Chapter 2 - Funding
First revision: Jul.24, 2024
Last change: Mar.27, 2026
Searched, gathered, rearranged, translated, and compiled by Apirak Kanchanakongkha.
.
Page 1
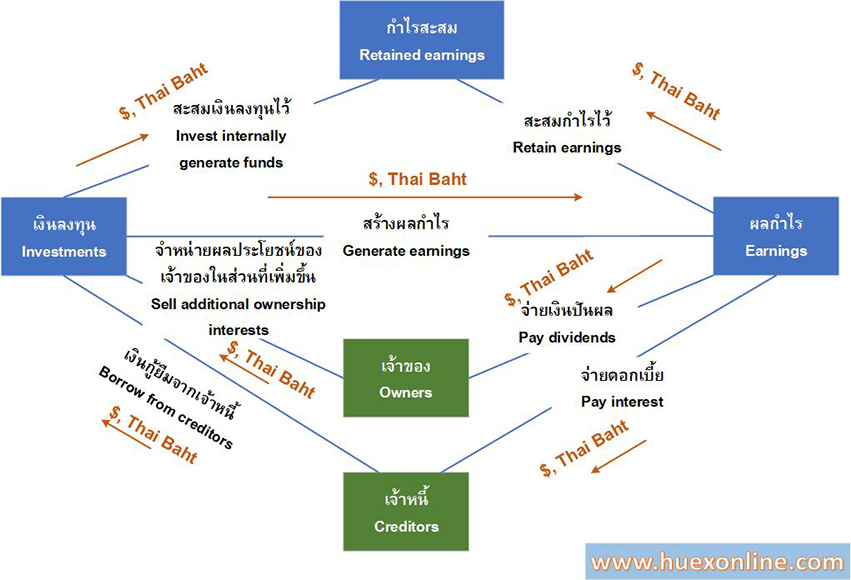 Figure 2.1 Financing a Company
.
.
Page 19
If the company has abundant earnings, the owners reap all that remains of the earnings after the creditors have been paid. If earnings are low, the creditors still must be paid what they are due, leaving the owners nothing out of the earnings. Failure to pay interest or principal as promised may result in financial distress. Financial distress is when a company makes decisions under pressure to satisfy its legal obligations to its creditors. These decisions may not be in the best interests of the company's owners.
With equity financing, there is no obligation. Though the company may choose to distribute funds to the owners in the form of cash dividends, there is no legal requirement to do so. Furthermore, interest paid on debt is deductible for tax purposes, whereas dividend payments are not.
One measure of the extent to which debt is used to finance a company is the debt ratio, the ratio of debt to equity:
Debt
Debt ratio = -----------
Equity
This is a relative measure of debt to equity. The greater the debt ratio, the greater the use of debt for financing operations relative to equity financing. Another measure is the debt-to-asset ratio, which is the extent to which the assets of the company are financed with debt:
Debt
Debt-to-assets ratio = -----------
Total Assets
This is the proportion of debt in a company's capital structure, measured using the book or carrying value of the debt and assets.
It is often helpful to focus on the long-term capital of a company when evaluating the capital structure of a company, looking at the interest-bearing debt of the company in comparison with the company's equity or with its capital. A company's capital is the sum of its interest-bearing debt and equity. The debt ratio can be restated as the ratio of the interest-bearing debt of the company to the equity:
.
.
Page 20
Interest-bearing debt
Debt-equity ratio = -------------------------
Equity
And the debt-to-assets can be restated as the proportion of interest-bearing debt of the company's capital:
Interest-bearing debt
Debt-to-capital ratio = -------------------------
Total capital
By focusing on long-term capital, a company's working capital decisions that affect current liabilities, such as accounts payable, are removed from this analysis.
The equity component of these ratios is often stated in book or carrying value terms. However, when examining a company's capital structure from a market perspective, debt capital is often compared with the market value of equity. In this latter formulation, for example, the company's total capital is the sum of the interest-bearing debt and the market value of equity.
If market values of debt and equity are the most useful for decision-making, should the CFO ignore book values? No, because book values are also relevant in decision-making. For example, bond covenants are often specified in terms of book values or ratios of book values. As another example, dividends are distinguished from the return of capital based on the availability of the book value of retained earnings. Therefore, though the focus is primarily on the market values of capital, the CFO must also keep an eye on the book value of debt and equity.
There is a tendency for companies in some sectors and industries to use more debt than others. We see this by looking at the capital structure for different sectors from a survey & study information, where the proportion of assets financed with debt and equity are shown graphically in terms of the book values of debt and equity. We can make some generalizations about differences in capital structures across sectors:
- Companies that rely more on research and development for new products and technology - for example, pharmaceutical companies - tend to have lower debt-to-asset ratios than companies without such research and development needs.
- Companies that require a relatively heavy investment in fixed assets tend to have lower debt-to-asset ratios.
It is also interesting to see how debt ratios compare within sectors and with industries within a sector. For example, within the utilities sector, the electric utility industry uses less debt than both the water and gas industries.
.
.
Page 21
Yet, debt ratios vary within each industry. For example, in the beverage industry, Cott Corporation, a maker of retail-brand soft drinks, has a much higher portion of debt in its capital structure than, say, the Coca-Cola Company.
Why do some industries tend to have higher debt ratios than others? By examining the role of financial leveraging, financial distress, and taxes, we can explain some of the variations in debt ratios among industries. By analyzing these factors, we can explain how the company's value may be affected by its capital structure.
CONCEPT OF LEVERAGE
The capital structure decision involves managing the risks associated with the company's business and financing decisions. The concept of leverage - in its operations and financing - plays a role in the company's risk because leverage exaggerates outcomes, good or bad.
.
.
Page 22
Consider the simple example of a company with fixed and variable expenses. Suppose it has one product with a sales price of $100 per unit and variable costs of$40 per unit. This means the company has a $60 profit per unit before considering any fixed expenses. This $60 is the product's contribution margin - the amount available to cover fixed expenses. Suppose the company's fixed expenses are $20 million. If the company produces and sells 250,000 units, it has a loss of $5 million; if it produces and sells 1 million units, it has a profit of $40 million. The company would have to produce and sell 1/3 million units before covering its fixed expenses; producing and selling more than 1/3 million produces a profit, and producing less than 1/3 million generates a loss. This 1/3 million is the break-even point: the number of units produced and sold such that the product of the units sold, and unit price covers the variable and fixed expenses.
The relation between the fixed cost, F, and the contribution margin can be specified in terms of the break-even quantity, QBE, the price per unit, P, the variable cost per unit, V, and the fixed costs:
. F
QBE = ----------------
(P - V)
Looking at the point from a broader range of units produced and sold, as shown in Panel A of Figure 2.3, the profit is upward sloping, with a slope of $60: Producing one additional unit produces a change in profit of $60, which is the contribution margin. In contrast, consider a similar scenario, but with a variable cost per unit of $20 and fixed cost of $40. In this case, the break-even number of units produced and sold is 500,000. However, this latter case has a greater use of fixed costs. This produces profit-units relations as shown in Panel B of figure 2.3, with a slope of $80. In the case of Panel B, there is more leverage: A greater relative use of fixed costs increases the losses and increase the profits.
Another way of quantifying the relation between the contribution margin and the fixed costs is to use the degree of leverage measure:
Q(P-V)
Degree of leverage = ———————————
Q(P-V)-F
The degree of leverage provides a measure of the sensitivity of the profit at a given level of production. In the above example with variable costs of $40 per unit and fixed costs of $20 million, the degree of leverage at 1 million units produced and sold is:
1($100-40) $60
Degree of leverage = ————- = ————- = 1.5
1($100-40)-$20 $40
Page 24
At 2 million units, the degree of leverage is:
2($100-40) $120
Degree of leverage = ——————- = ——- = 1.2
2($100-40)-$20 $100
The degree of leverage is undefined at the break-even point - 1/3 million units in this case - because the profit in the denominator is zero. The degree of leverage beyond the break-even point declines: As the company moves farther away from the break-even point, the effect of leverage - and hence risk - lessens, as shown in Figure 2.4.
Leverage and Operating Risk
The concept of leverage and the degree of leverage can be used to describe the operating risk of a company, which is a component of a company’s business risk. Business risk is the uncertainty associated with the earnings from operations.
Business risk is the uncertainty inherent in the type of business and can be viewed as comprising sales risk and operating risk. Sales risk is the risk associated with sales resulting from economic and market forces that affect the volume and prices of goods or services sold. Operating risk is the risk associated with the cost structure of the company’s assets. A cost structure comprises both fixed operating costs and variable operating costs. The greater the fixed costs relate to variable costs, the greater the leverage and, hence, operating risk. If sales were to decline, the greater the fixed costs in the operating cost structure, the more exaggerated the effect on operating earnings.
1.
2.
Page 25
In the context of a company's operating risk, the degree of leverage is referred to as the degree of operating leverage (DOL). In this case, the fixed costs that operate as a fulcrum in this leverage are specifically the fixed operating costs.
1.
Leverage and Financial Risk
The effect of the mixture of fixed and variable costs on operating earnings is akin to the effect of debt financing on earnings to owners. Here, it is referred to as financial leverage, which we describe shortly. The greater the fixed financing costs in the capital structure, the greater the earnings-leverage effect for owners from a given change in operating earnings. The degree of leverage in a company's capital structure is referred to as the degree of financial leverage (DFL).
Both operating leverage and financial leverage have a bearing on a company’s financial risk. This is because of the compounding effect of operating leverage upon financial leverage, to affect the total leverage of the company. In fact, there is a multiplicative effect of the two leverages, such that the degree of total leverage (DTL) of a company is the product of its degree of operating leverage and its degree of financial leverage:
DTL = DOL x DFL
Therefore, the greater the business risk of the company, the greater the risk associated with a company’s earnings to owners. The import of this is that a CFO must consider both the degree of operating leverage and the degree of financial leverage when managing the company's risk.
1.
2.
CAPITAL STRUCTURE AND FINANCIAL LEVERAGE
Debt and equity financing create different types of obligations for the company. Debt financing obligates the company to pay creditors’ interest and principal, usually at fixed rates, when due. If the company earns more than is necessary to meet its debt payments, it can either distribute the surplus to its owners or reinvest it. Equity financing does not obligate the company to distribute earnings. The company may pay dividends or repurchase stock from the owners, but there is no obligation to do so.
The fixed and limited nature of the debt obligation affects the risk to owners' earnings. Consider Capital Corporation, which has $20 million in assets, all financed with equity. There are 1 million shares of Capital Corporation stock outstanding, valued at $20 per share. The company’s current balance sheet is simple:
1
1
1